Double Bottom Chart Pattern Seen on Nifty
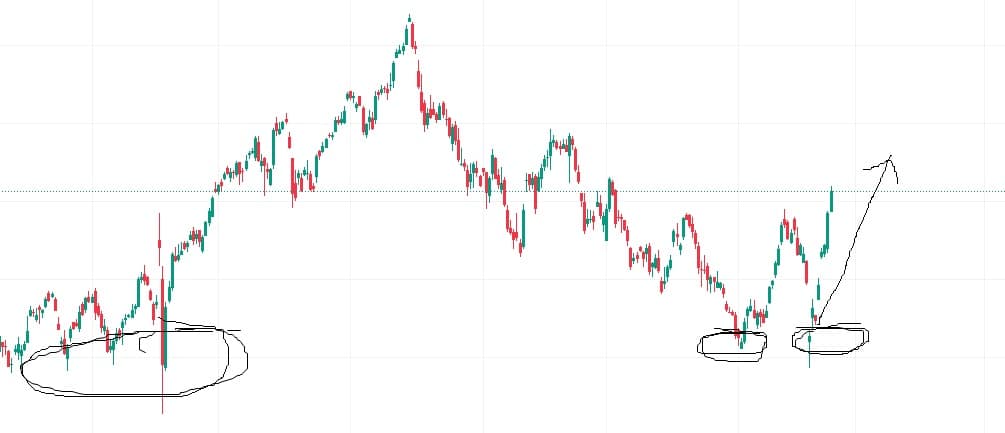
The double bottom patterns was seen on daily chart of Nifty recently which is a classic reversal chart pattern that signals a potential change in trend direction. Nifty had been in a consistent downtrend for the past six months, falling to the 22,000 level twice during March and April.
However, a sharp rebound has been observed, with Nifty climbing back up to the 24,000 level in just eight trading sessions. This strong upward movement indicates bullish momentum in the short to medium term.
If Nifty manages to hold above the 23,000 level for the next few months, the uptrend may continue. Otherwise, a period of consolidation could follow before the next directional move.
📊 Technical Analysis Overview
- Chart Pattern: Double Bottom (seen near 22,000 levels)
- Support Level: 23,000
- Resistance Zone: 24,500 – 24,700
- Momentum Indicator (RSI): Currently above 60 – bullish territory
- MACD: Positive crossover seen, confirming upward momentum
- Volume: Increased volume during bounce – supports trend reversal